Monitoring with Prometheus and Grafana
The Madeinoz Knowledge System includes a built-in monitoring stack to help you track token usage, costs, cache performance, and errors in real-time.
What You'll See
The monitoring stack gives you visibility into:
- Token usage - How many tokens you're using across models
- Costs - Real-time cost tracking by model and operation
- Performance - Request durations and latency percentiles
- Cache efficiency - Hit rates and cached token savings
- Errors - Any failures that occur during operations
Getting Started
Development Environment
If you're running the development environment, monitoring is already enabled:
Access the dashboards:
- Grafana: http://localhost:3002 (FalkorDB dev) or http://localhost:3003 (Neo4j dev)
- Prometheus: http://localhost:9092
Production Environment
In production, monitoring is optional. Enable it with the --profile flag:
# Start with monitoring enabled
docker compose -f src/skills/server/docker-compose-falkordb.yml --profile monitoring up -d

# Or for Neo4j backend
docker compose -f src/skills/server/docker-compose-neo4j.yml --profile monitoring up -d
Access points:
- Grafana: http://localhost:3001 (Neo4j) or http://localhost:3002 (FalkorDB)
- Prometheus: http://localhost:9092
Logging into Grafana
When you first access Grafana, you'll see the login screen:
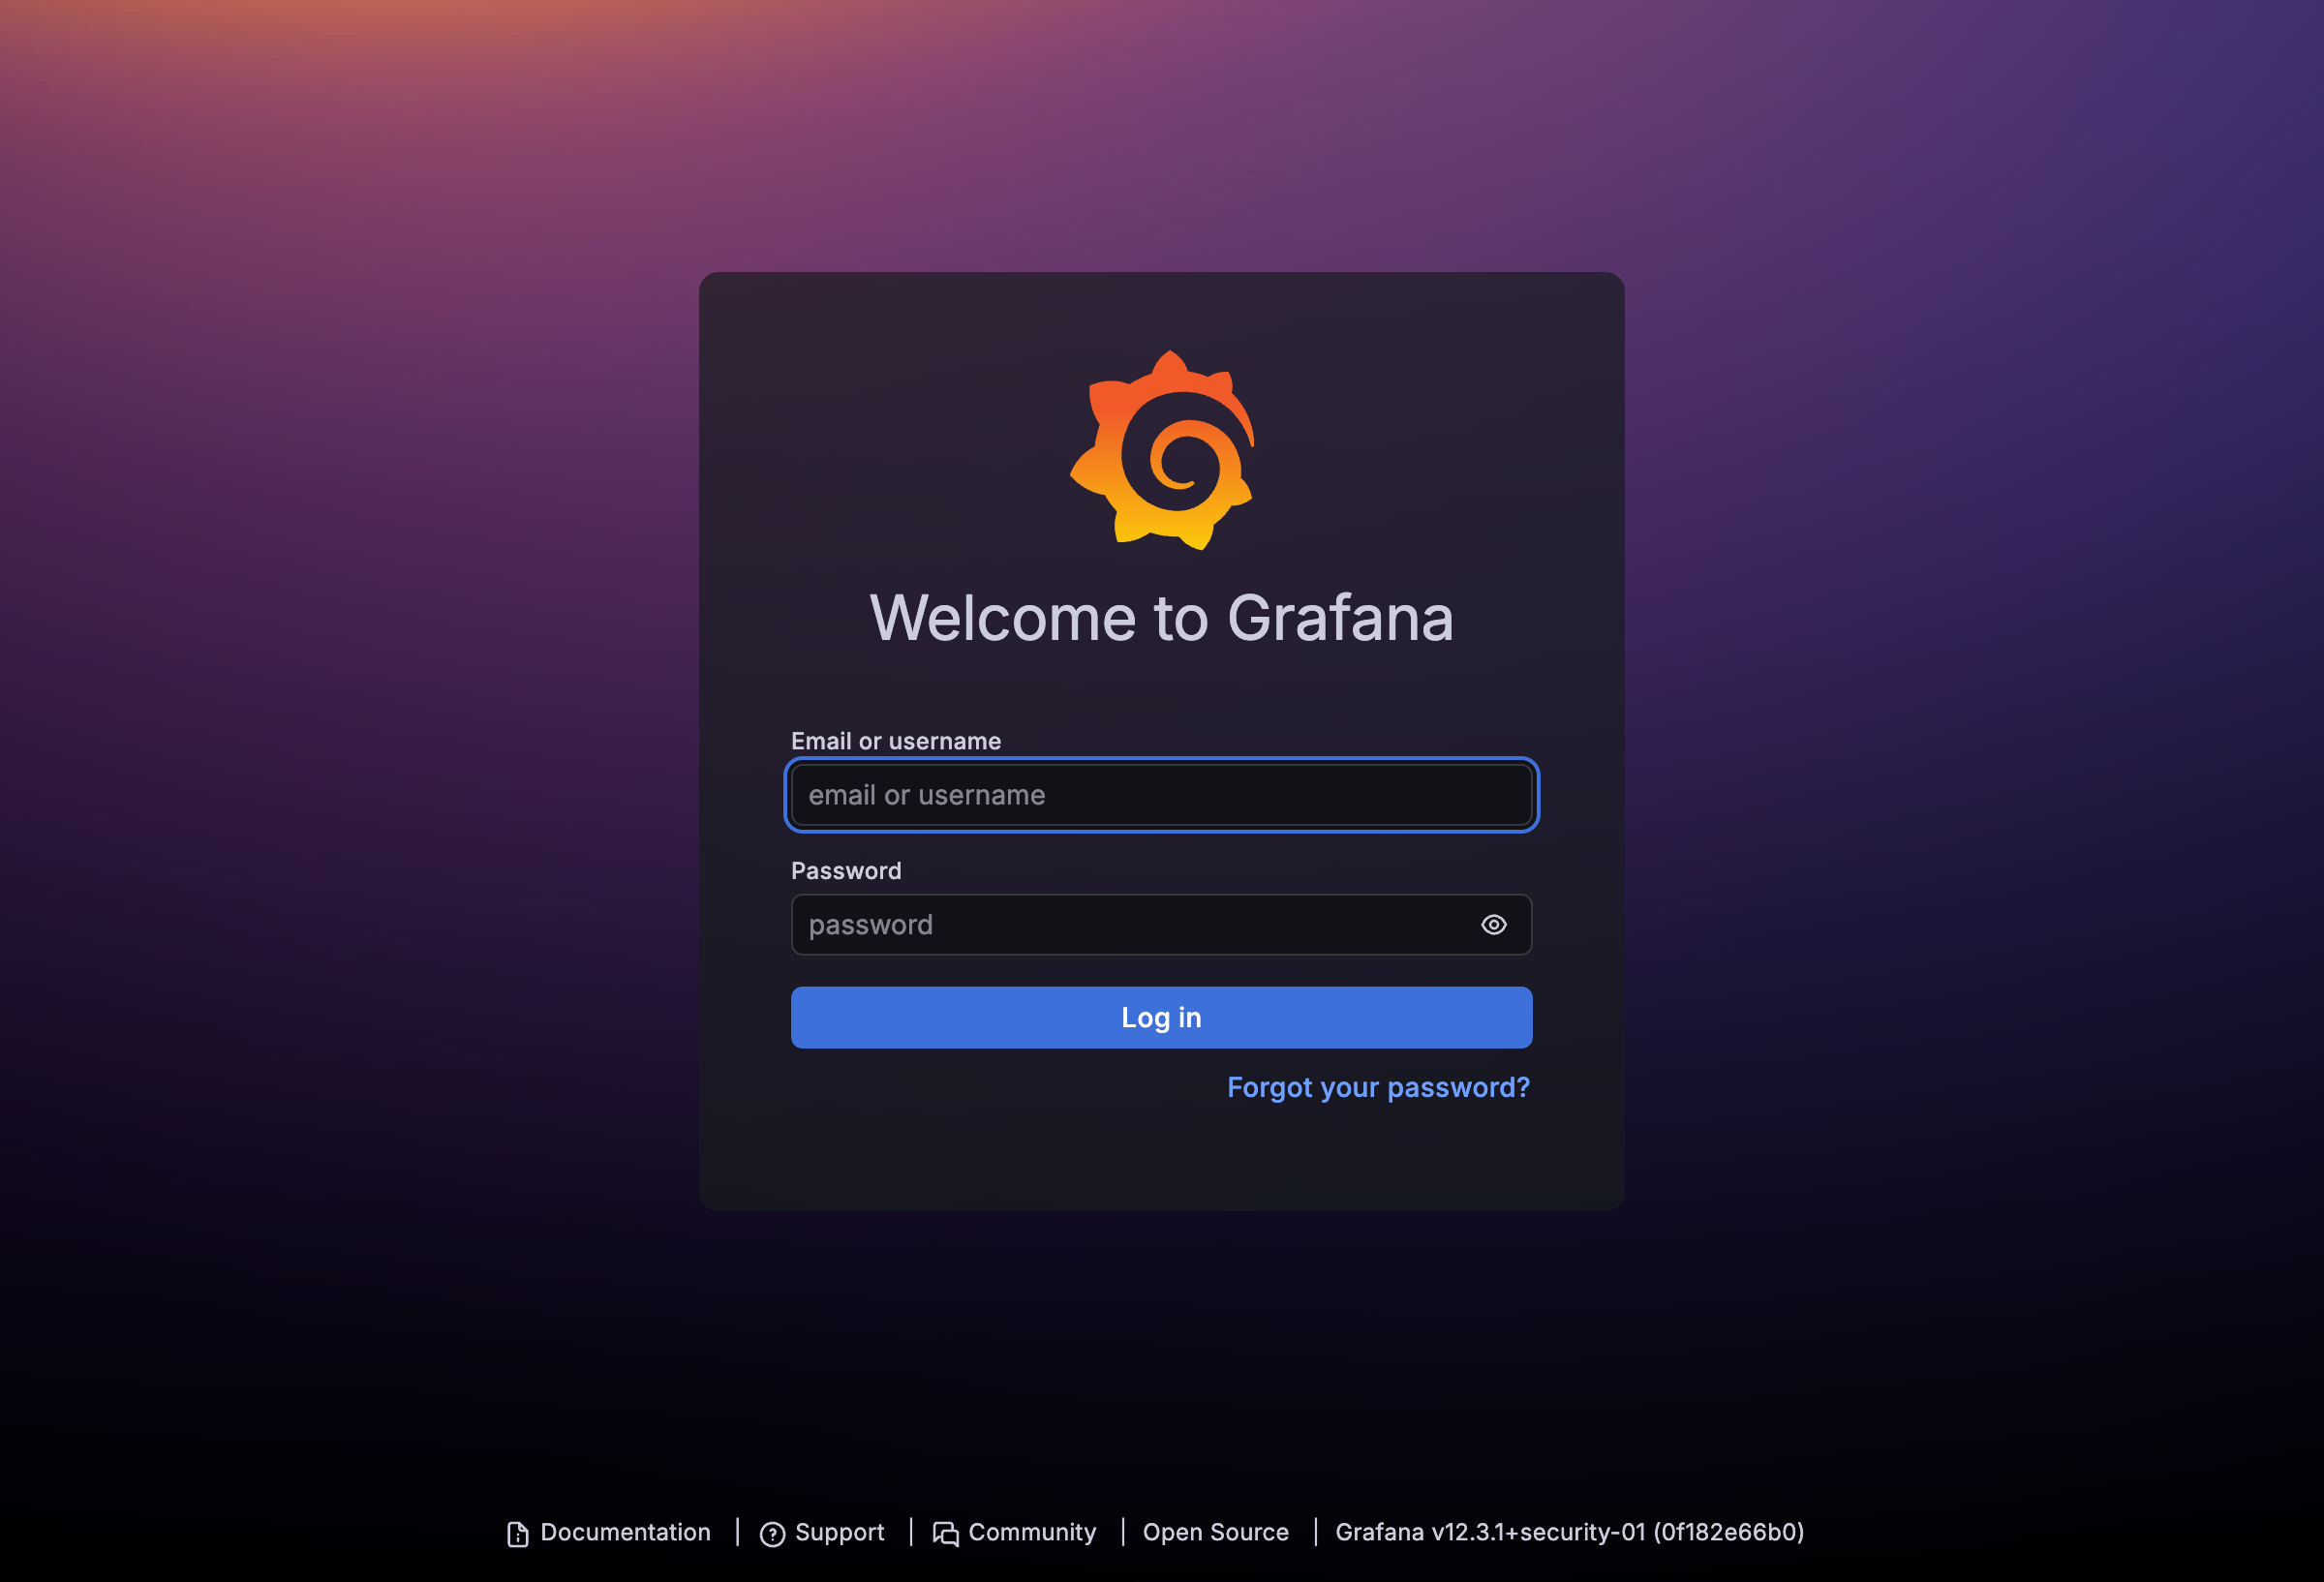
Default credentials:
| Field | Value |
|---|---|
| Username | admin |
| Password | admin |
You'll be prompted to change the password on first login - you can skip this for local development.
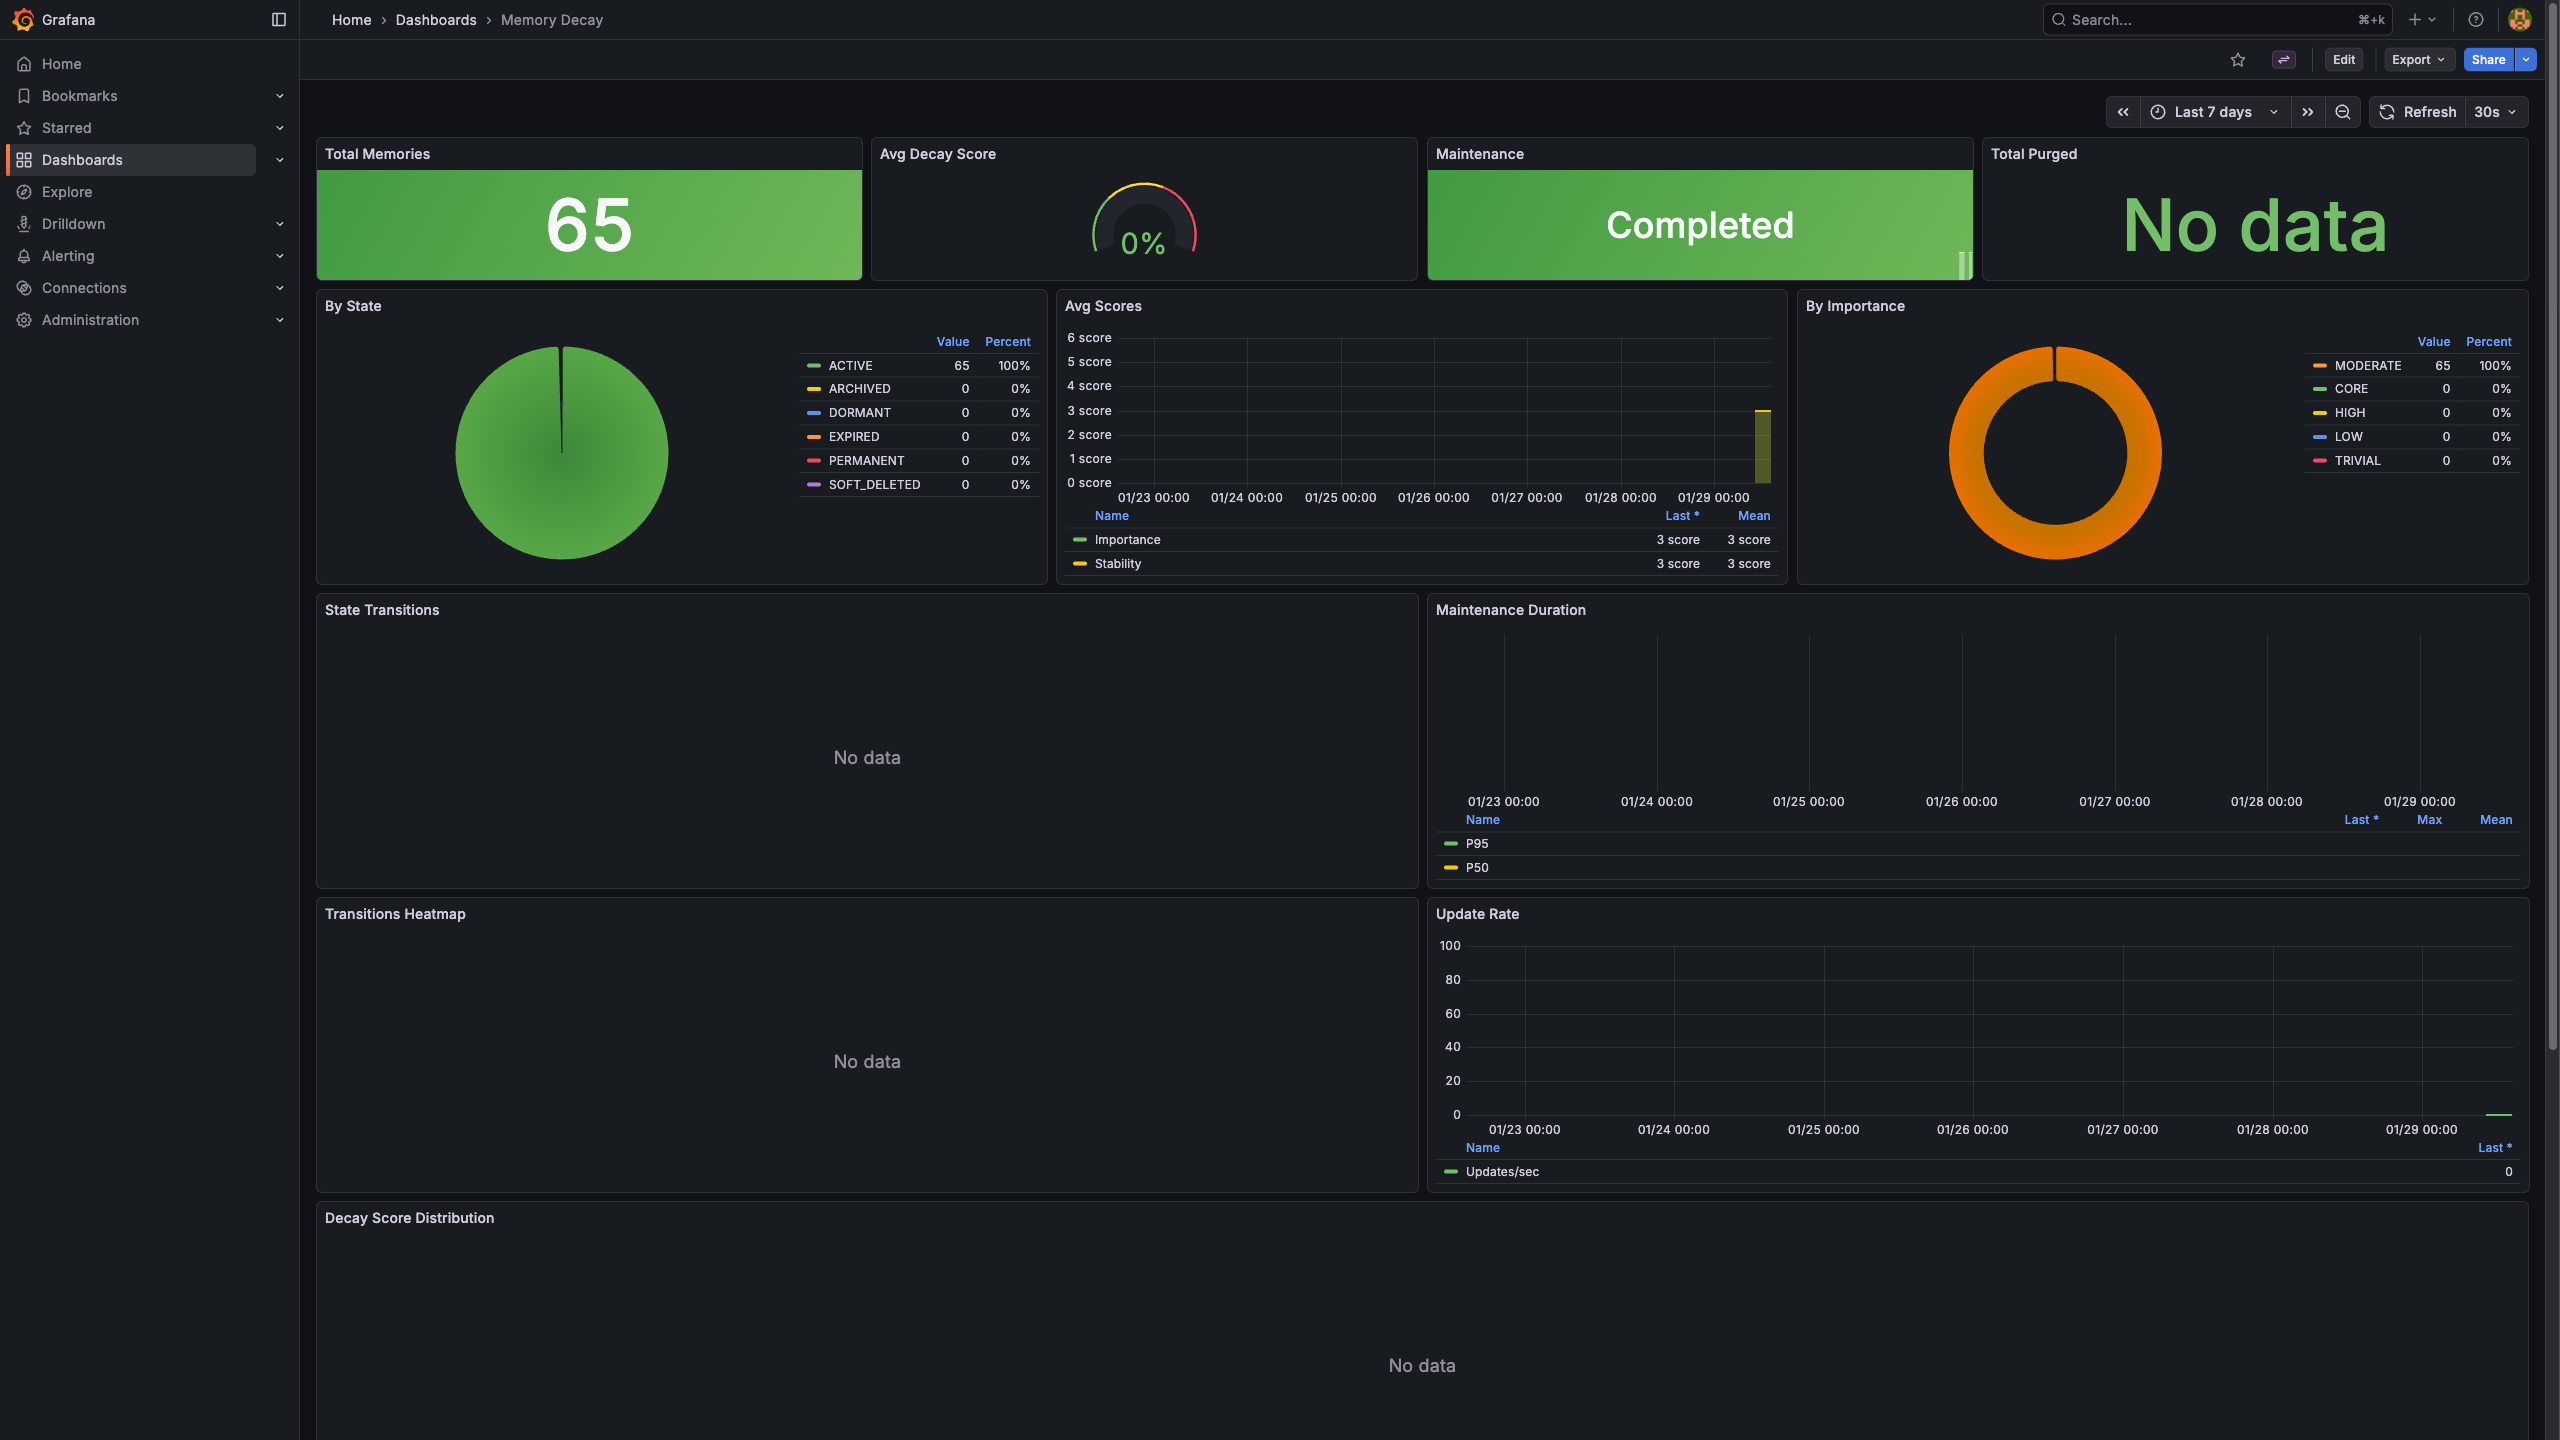
The Dashboard
After logging in, navigate to Dashboards in the left sidebar. You'll find the Madeinoz Knowledge System dashboard pre-configured.
The dashboard has six sections:
Overview Row
Quick stats at a glance:
| Panel | What It Shows |
|---|---|
| Total API Cost | Cumulative cost in dollars |
| Total Tokens Used | Combined prompt + completion tokens |
| Cache Status | Whether caching is enabled |
| Cache Hit Rate | Percentage of cache hits |
| Total Errors | Count of failed operations |
Token Usage Row
Detailed token metrics:
- Token Usage Rate - Tokens per second by model
- Prompt vs Completion - Breakdown of input vs output tokens
Cost Tracking Row
Financial metrics:
- Cost Rate - Dollars per hour by model
- Cost by Model - Pie chart of spending distribution
- Input vs Output Cost - Cost breakdown by token type
Request Duration Row
Performance metrics:
- Request Duration - Response time histogram
- Duration Percentiles - P50, P90, P99 latencies
- Requests per Second - Throughput over time
Cache Performance Row
Caching effectiveness:
- Cache Hits vs Misses - Hit rate visualization
- Cached Tokens - Tokens served from cache
- Cache Efficiency - Cost savings from caching
Errors Row
Error tracking:
- Errors by Type - Breakdown by operation
- Error Rate - Errors per minute trend
Verifying Prometheus is Working
You can check that Prometheus is scraping metrics correctly:
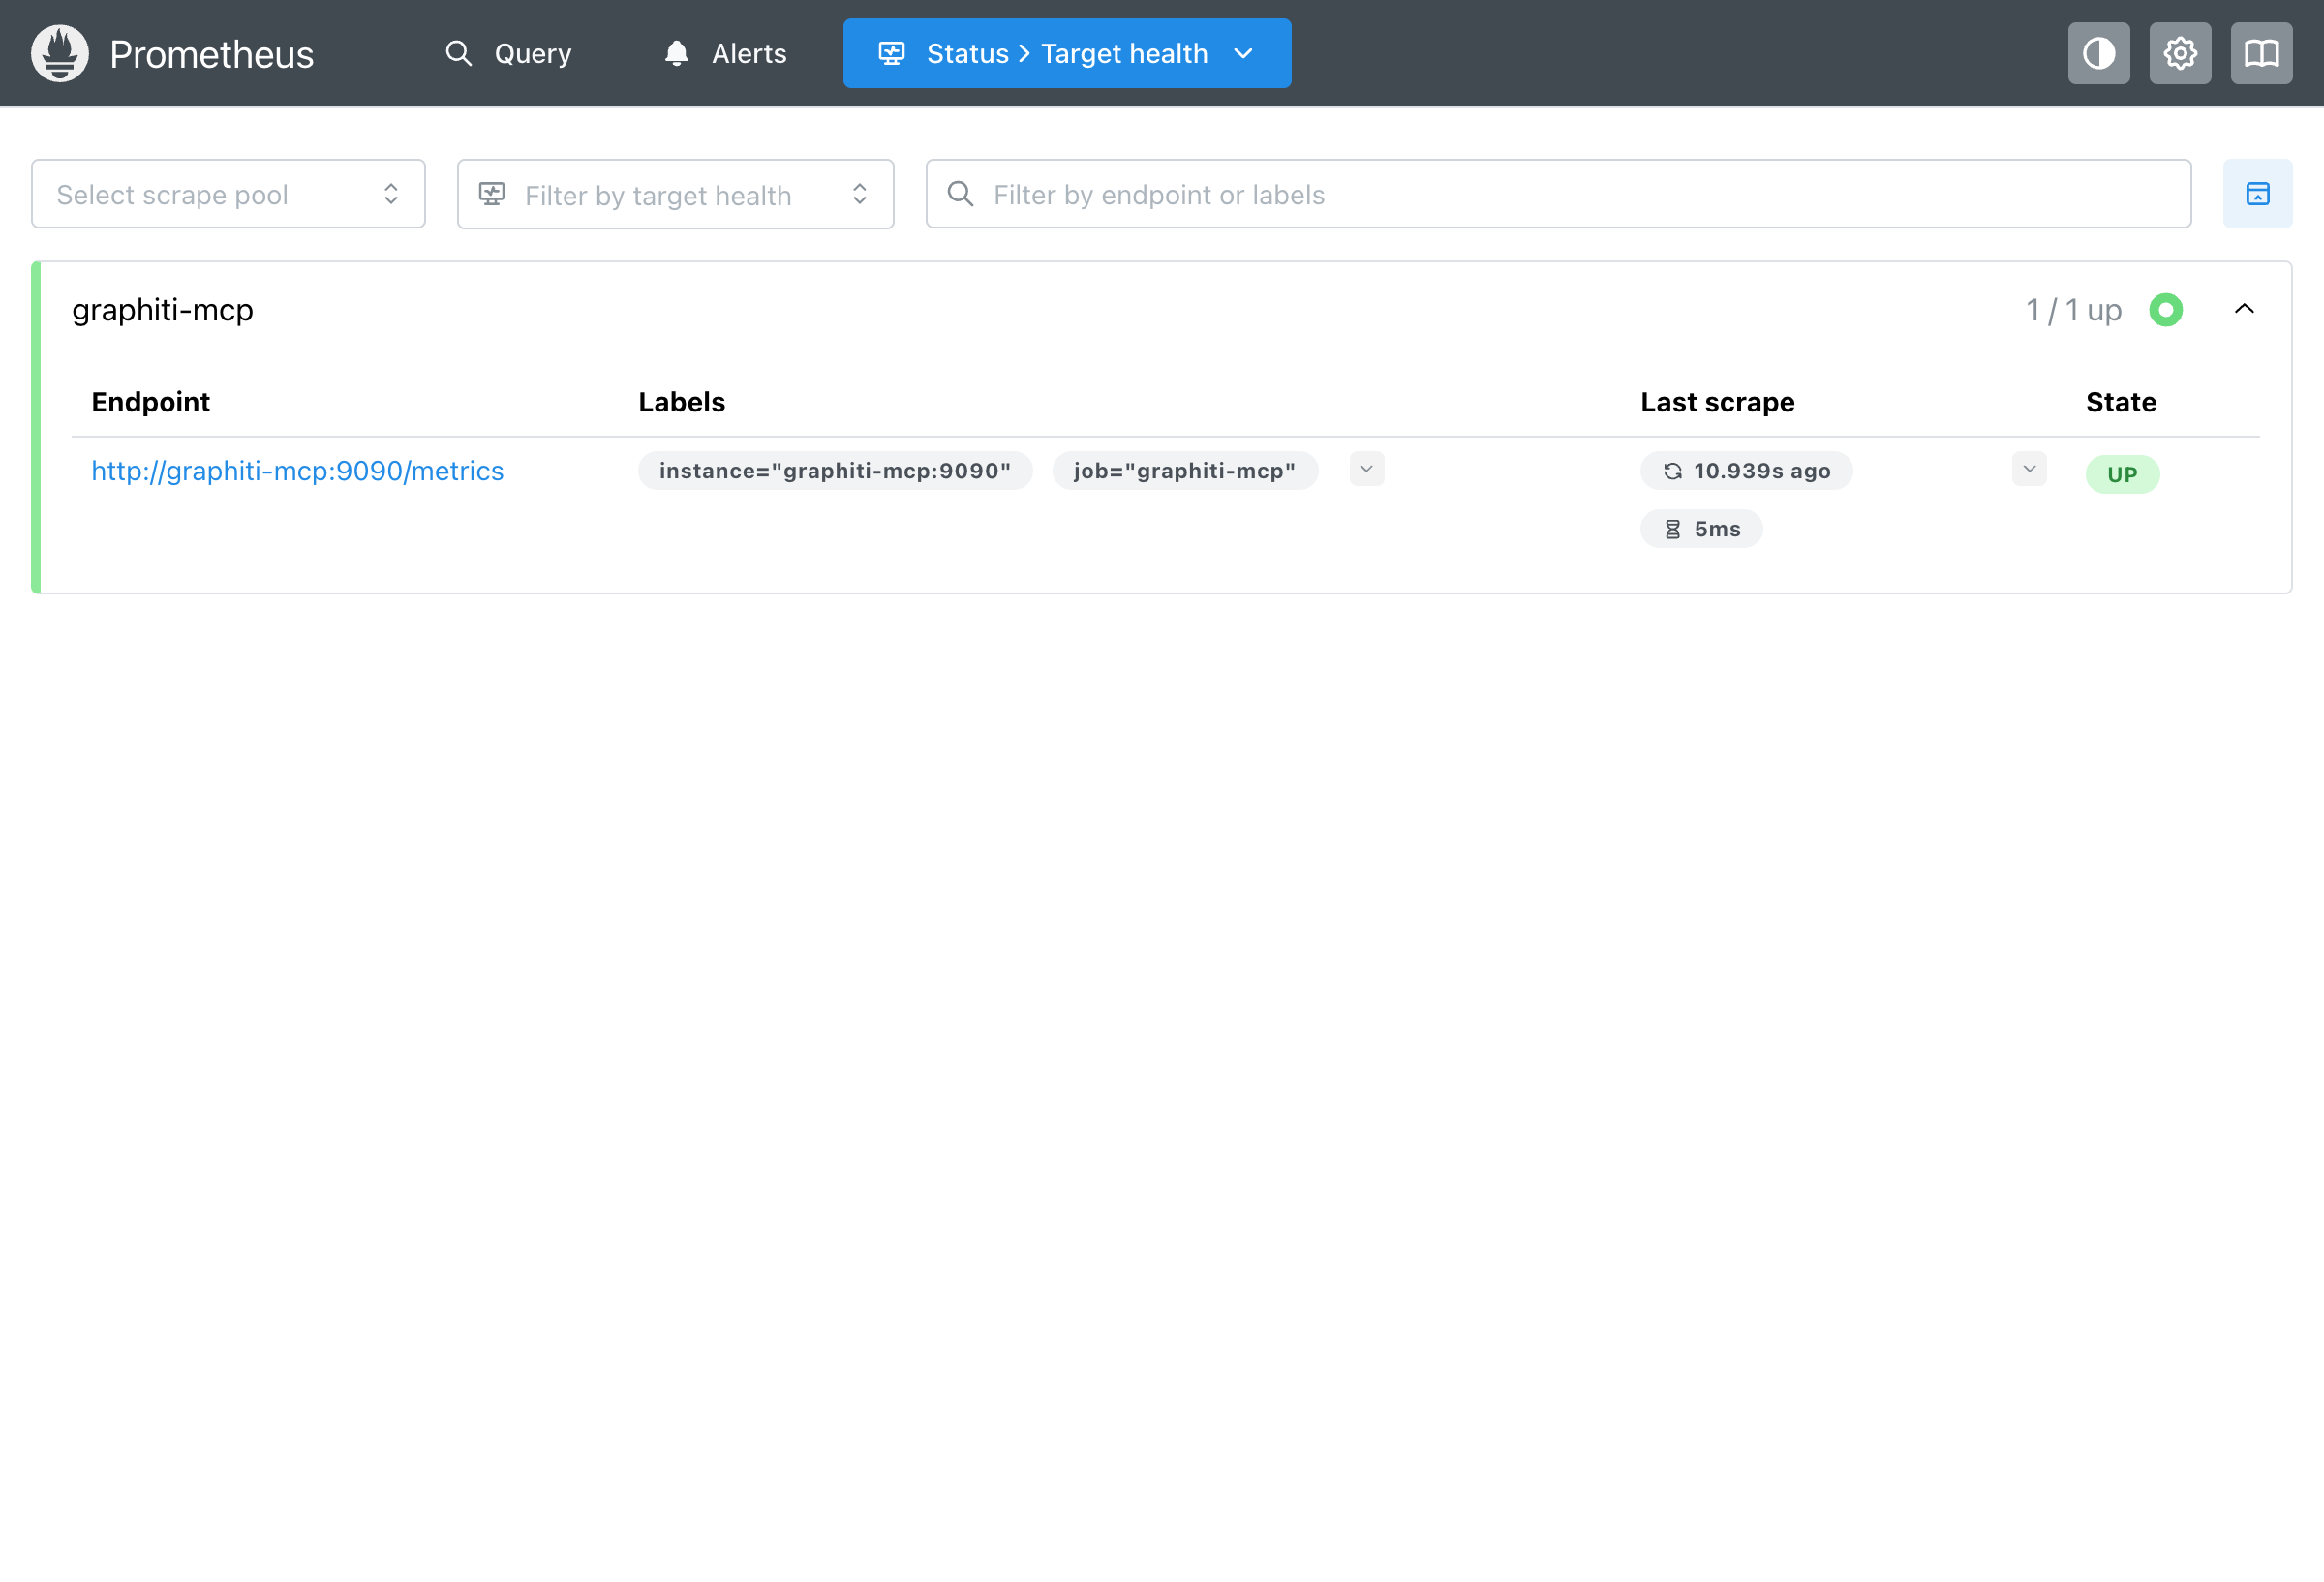
Navigate to http://localhost:9092/targets and verify:
- The graphiti-mcp target shows UP status
- Last scrape was recent (within 15 seconds)
- Scrape duration is low (typically <100ms)
Checking Raw Metrics
To see the raw metrics being collected:
# From the host (dev environment)
curl http://localhost:9091/metrics

# Example output
graphiti_prompt_tokens_total{model="google/gemini-2.5-flash"} 12456
graphiti_completion_tokens_total{model="google/gemini-2.5-flash"} 3721
graphiti_cache_hit_total 847
graphiti_cache_miss_total 153
graphiti_request_duration_seconds_bucket{le="0.1"} 234
Port Reference
| Service | Dev Port | Prod Port | Notes |
|---|---|---|---|
| Grafana | 3002 (FalkorDB), 3003 (Neo4j) | 3001 (Neo4j), 3002 (FalkorDB) | Dashboard UI |
| Prometheus | 9092 | 9092 | Query interface |
| MCP Metrics | 9091 | 9090 (internal) | Scraped by Prometheus |
Customizing the Dashboard
The dashboard is auto-provisioned but you can customize it:
- Click Edit in the top-right corner
- Modify panels, add queries, adjust time ranges
- Click Save dashboard to persist changes
Note: Provisioned dashboards reset on container restart. To keep changes, export the dashboard JSON and save it to config/monitoring/grafana/provisioning/dashboards/.
Environment Variables
| Variable | Default | Description |
|---|---|---|
GRAFANA_ADMIN_PASSWORD |
admin |
Grafana admin password |
Set this in your .env file to change the default password:
Troubleshooting
Grafana shows "No Data"
- Check Prometheus is scraping successfully at http://localhost:9092/targets
- Verify the MCP server is running:
docker ps | grep mcp - Make some knowledge operations to generate metrics
Can't connect to Grafana
- Verify the container is running:
docker ps | grep grafana - Check the correct port for your environment (dev vs prod, FalkorDB vs Neo4j)
- Check container logs:
docker logs madeinoz-knowledge-grafana-dev
Prometheus target is DOWN
- Check the MCP server is healthy:
curl http://localhost:8001/health - Verify network connectivity between containers
- Check Prometheus logs:
docker logs madeinoz-knowledge-prometheus-dev
Quick Reference
| Task | Command |
|---|---|
| Start dev with monitoring | bun run server start --dev |
| Start prod with monitoring | docker compose -f <compose-file> --profile monitoring up -d |
| Stop monitoring only | docker compose -f <compose-file> --profile monitoring down |
| View Grafana | http://localhost:3002 (check port table above) |
| View Prometheus | http://localhost:9092 |
| Check targets | http://localhost:9092/targets |
| View raw metrics | curl http://localhost:9091/metrics |
Next Steps
- Explore the observability reference for detailed metric descriptions
- Learn about advanced usage patterns for optimization tips
- Explore detailed metrics reference for all available metrics